Teaching sets
Crystallization in reciprocal space
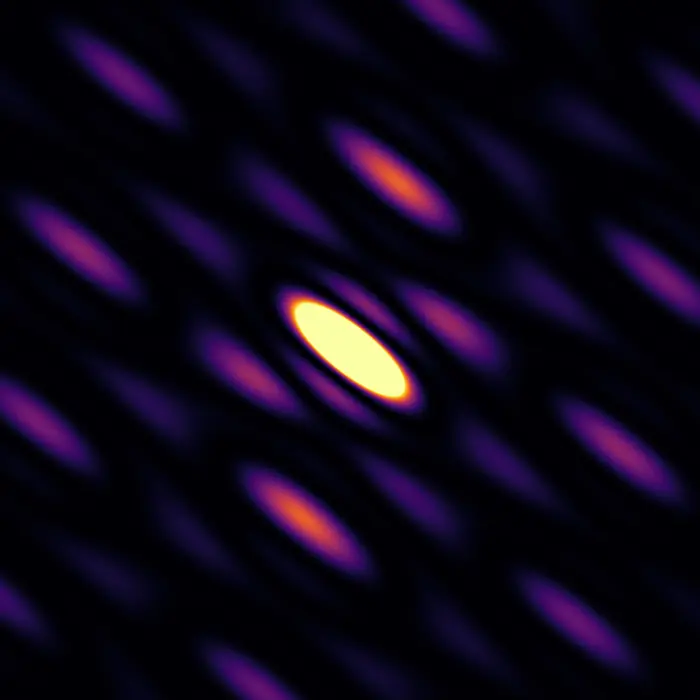
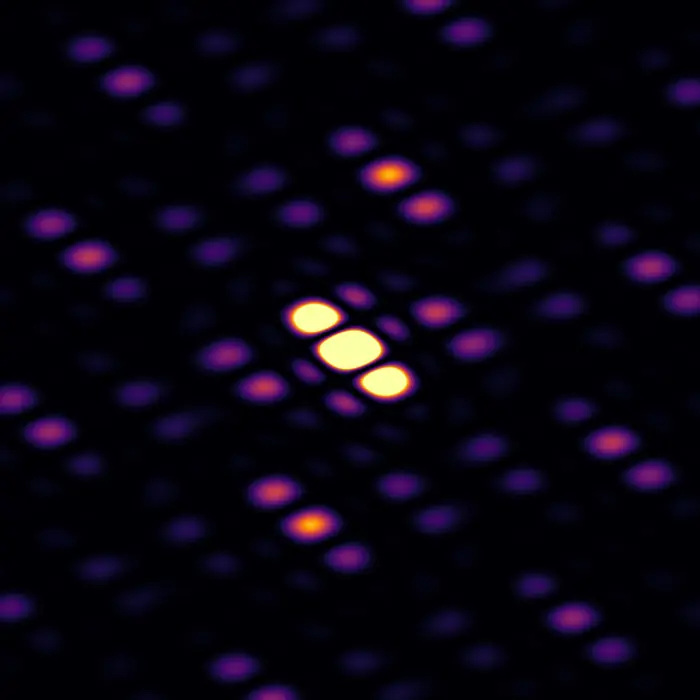
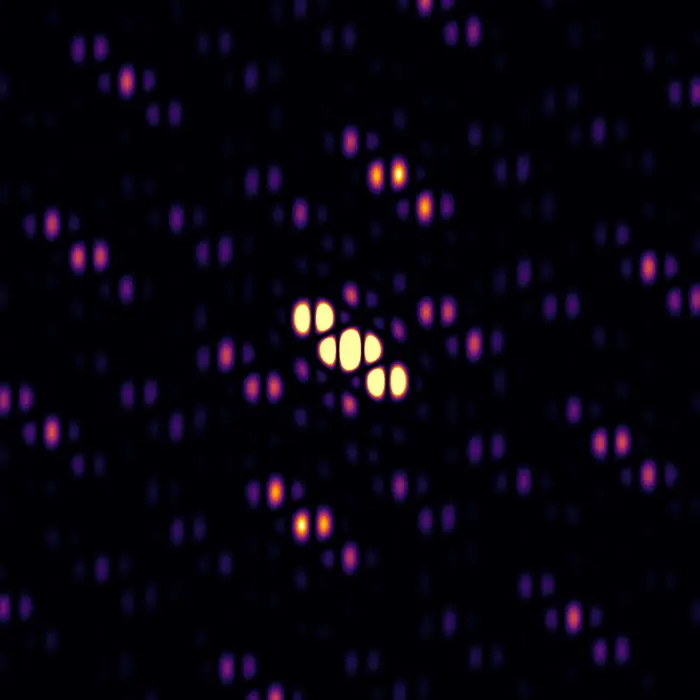
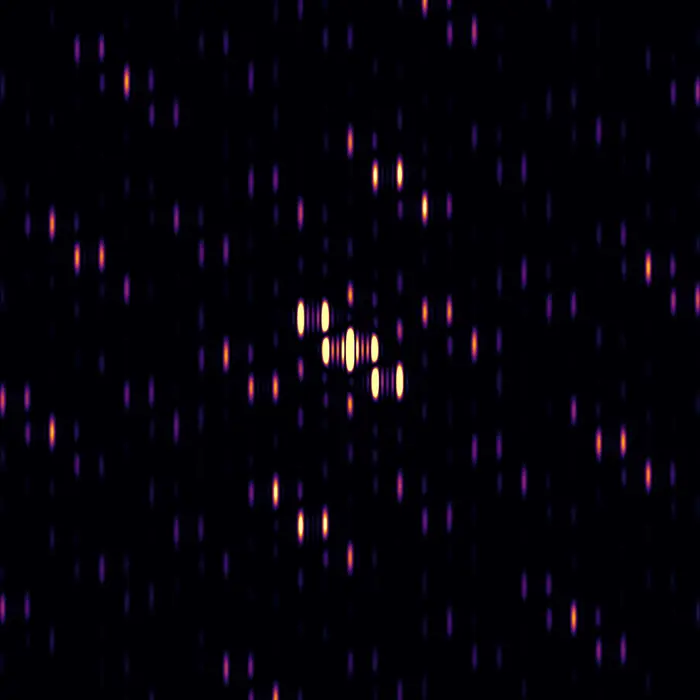
When illuminated with suitable radiation (typically X-ray, electron or neutron beams) crystals produce diffraction patterns. Why are these patterns the way they are? Why do they have pointy Bragg peaks, or broad clouds, or sharp streaks of intensity?
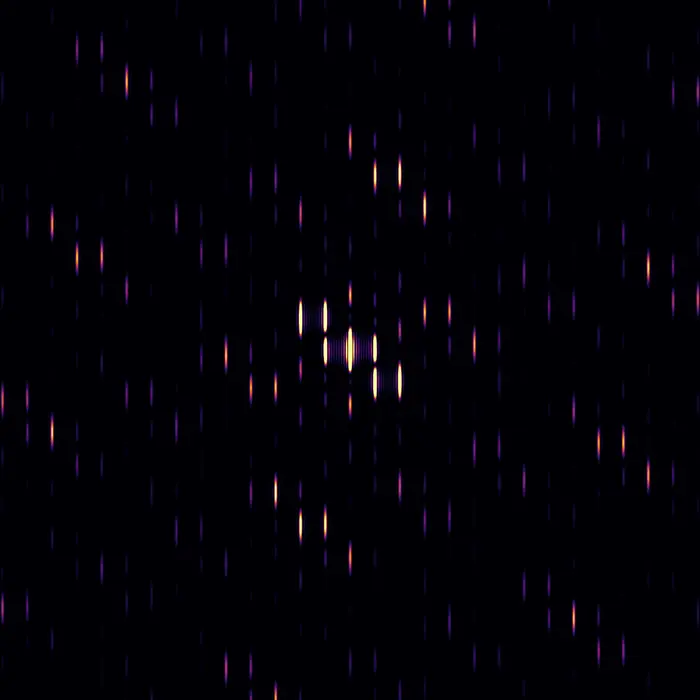
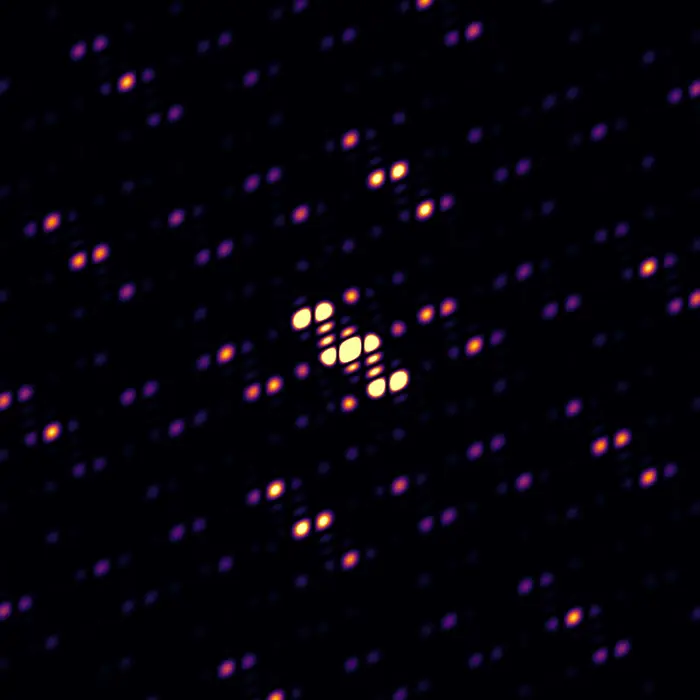
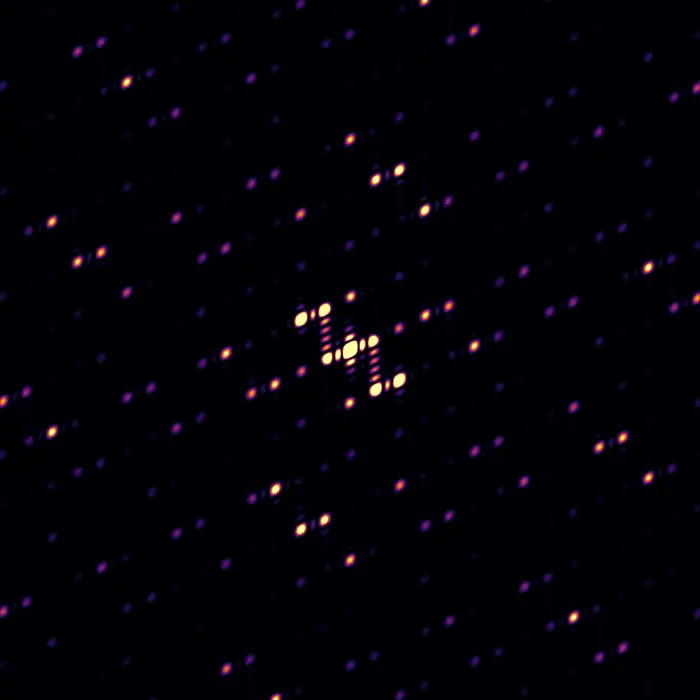
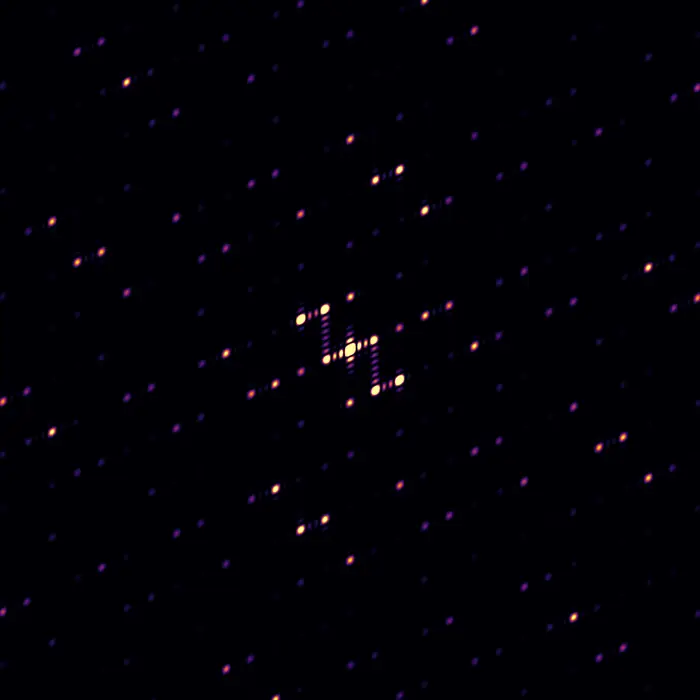
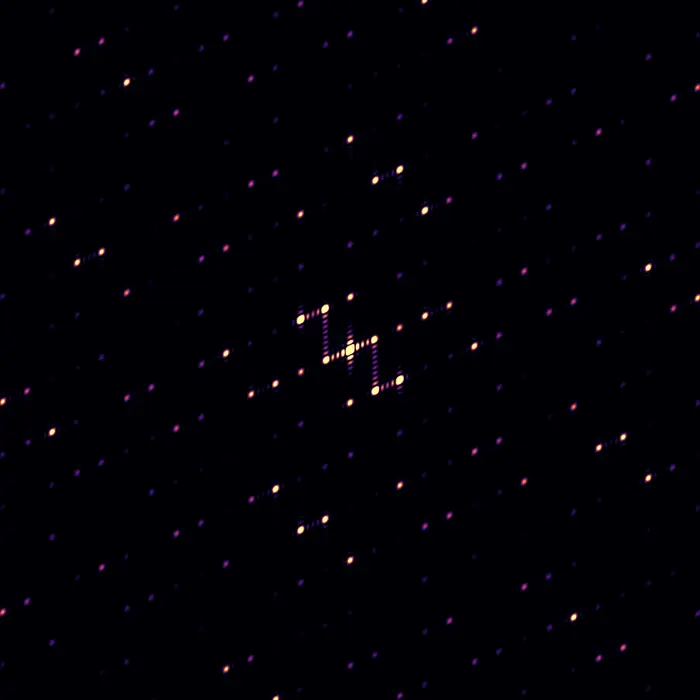
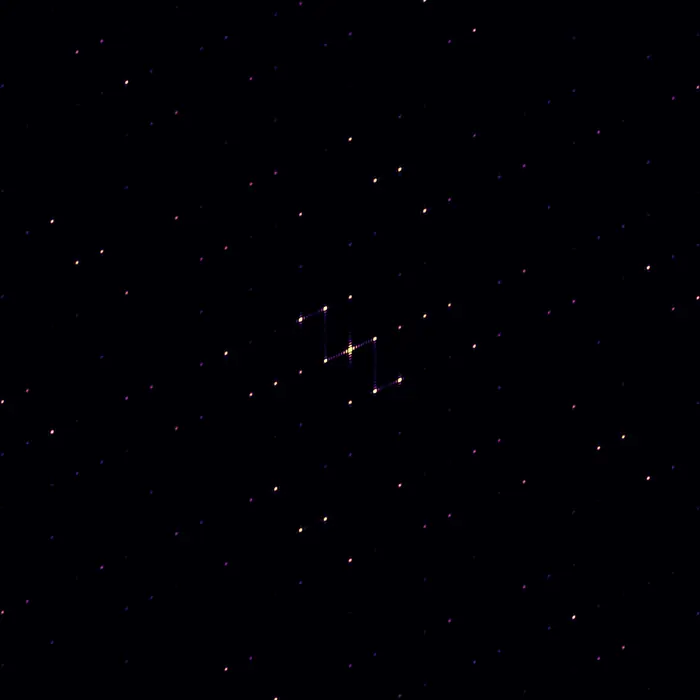
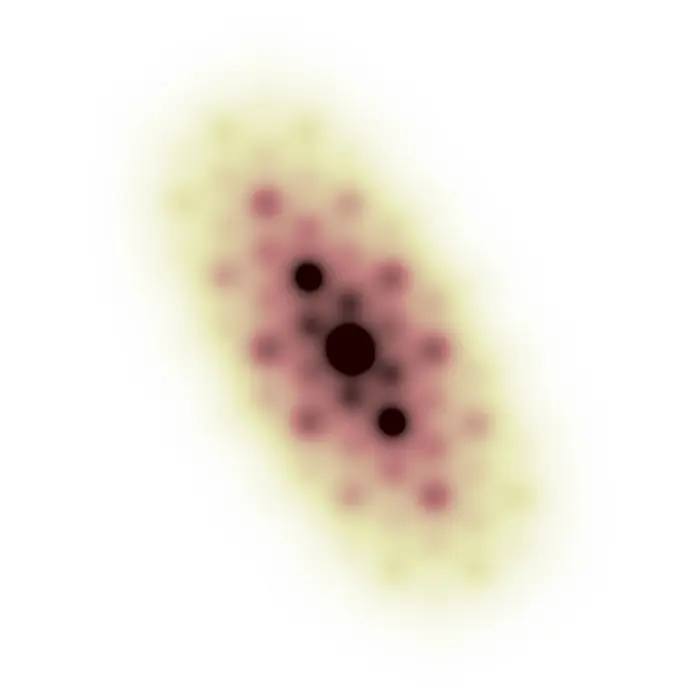
The continuous nature of diffraction patterns and the importance of atom–atom spatial relationships (a.k.a. correlations) are exemplified in this collection by considering the step-wise growth of a naphthalene crystal.
Pick a structure above to see the diffraction pattern it produces.
 Scattering pattern
Molecular form factor
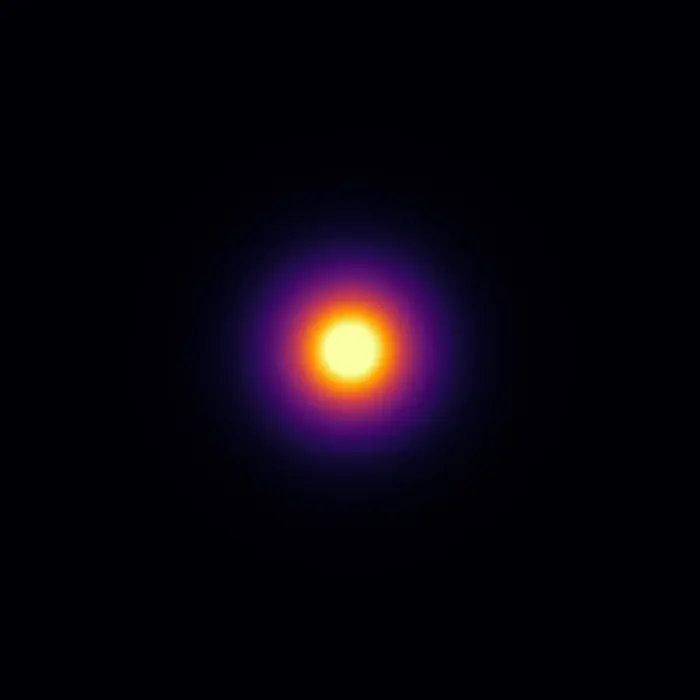
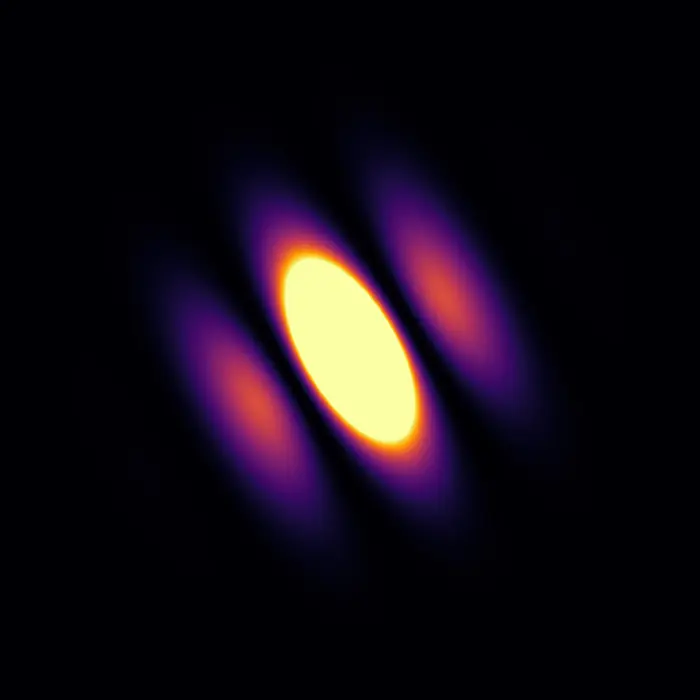
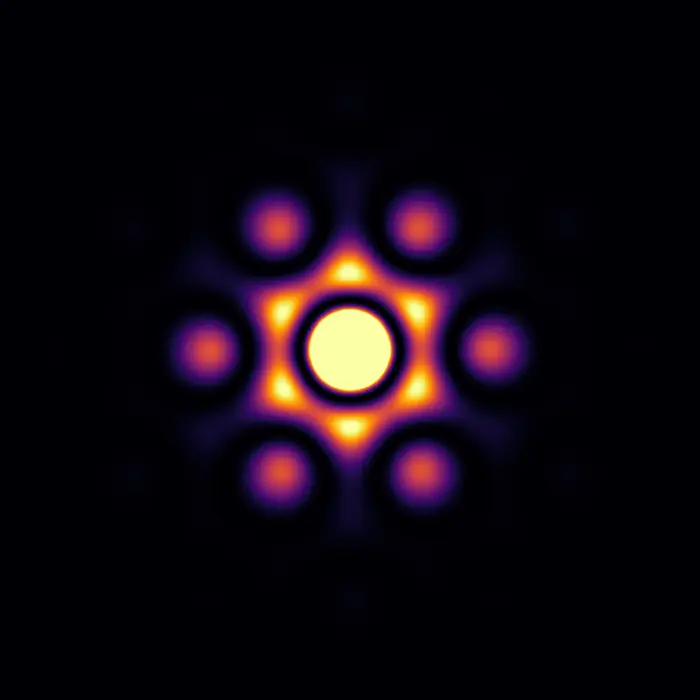
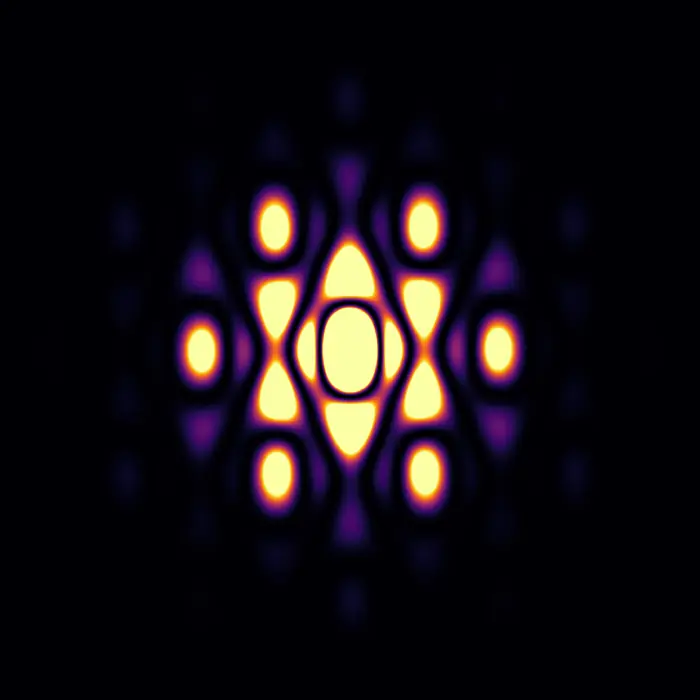
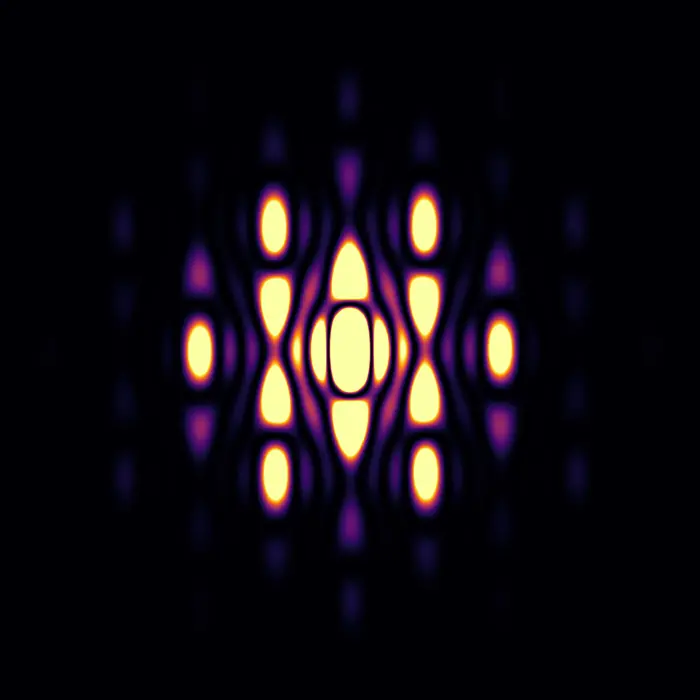
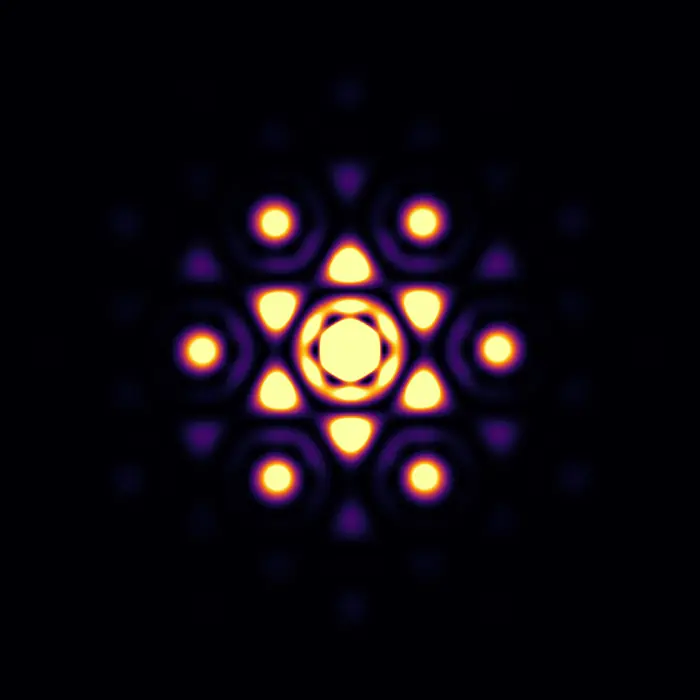
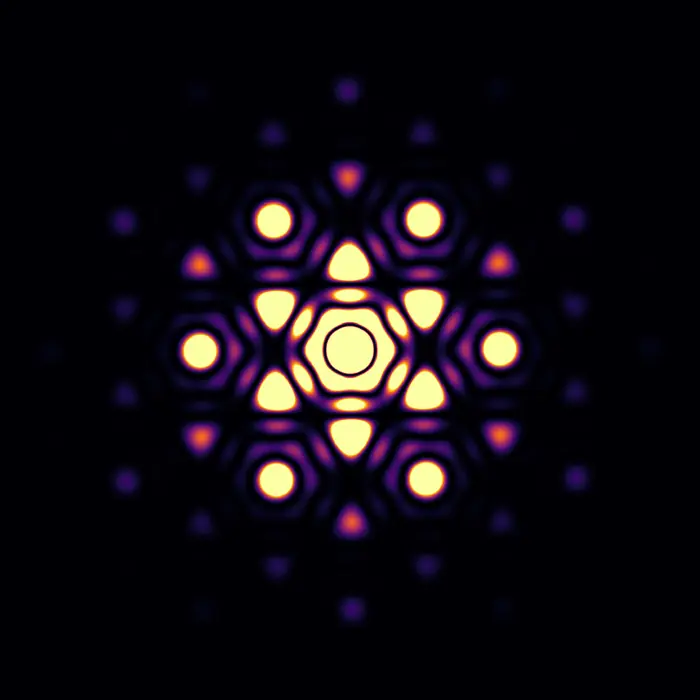
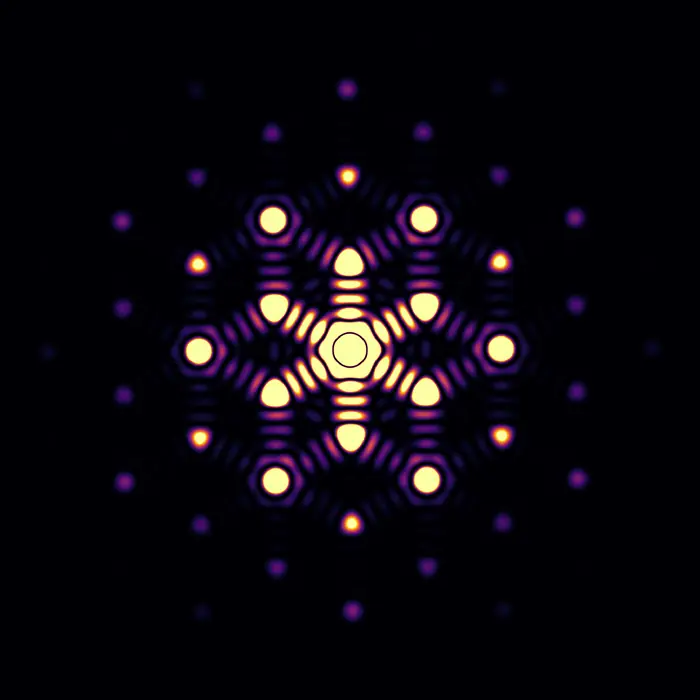
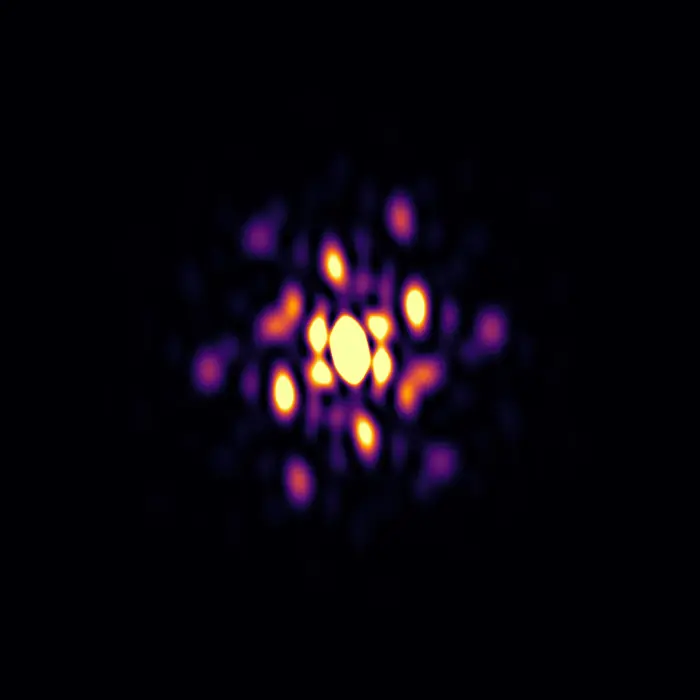
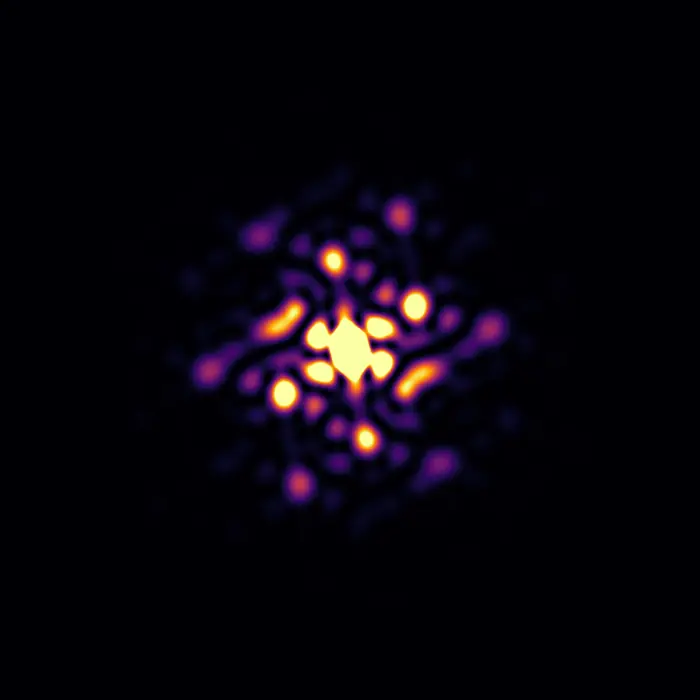
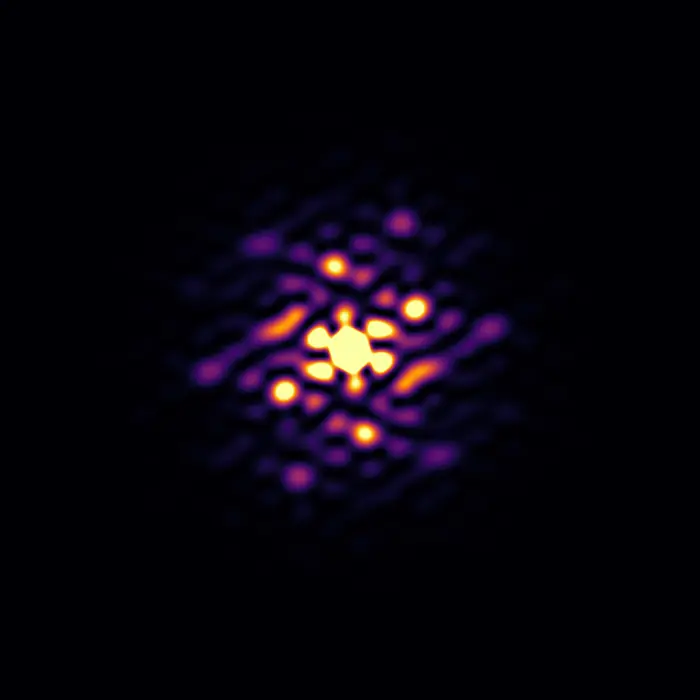
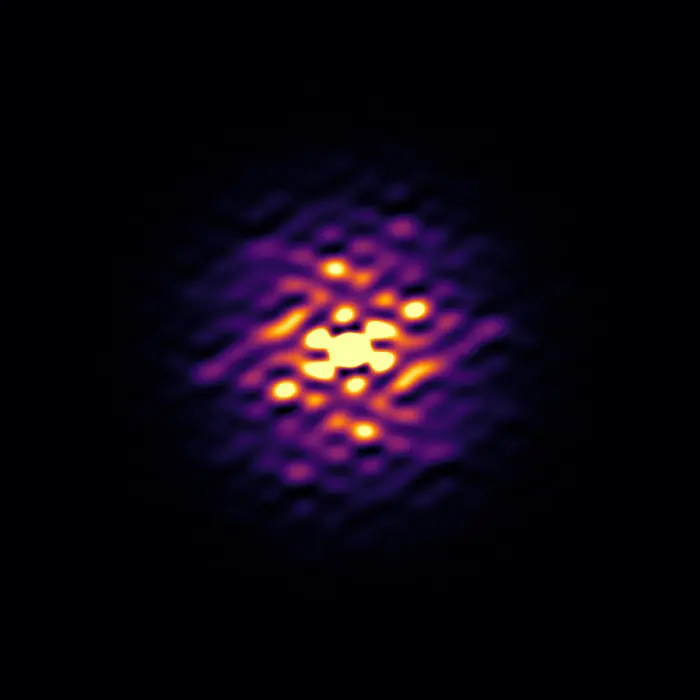
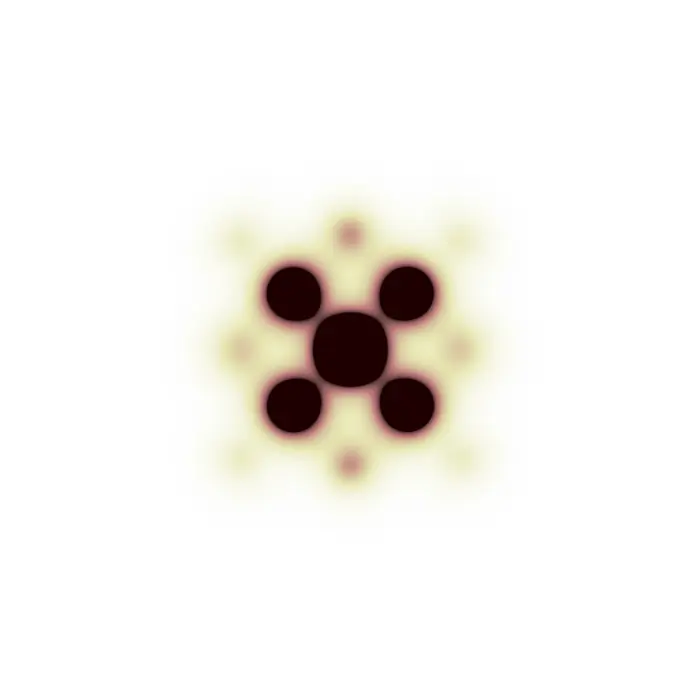
The molecular form factor (that is, the Fourier transform of a molecule’s scattering centres) has a major impact on diffraction patterns, since their intensity distribution is defined by the unit cell content, which consists of atoms that can be found assembled in molecules.
In this teaching set we observe how different arrangements of atoms produce different diffraction patterns, where the distribution of intensities itself originates from the molecular form factor. X-ray scattering factors were used for each pattern calculation.
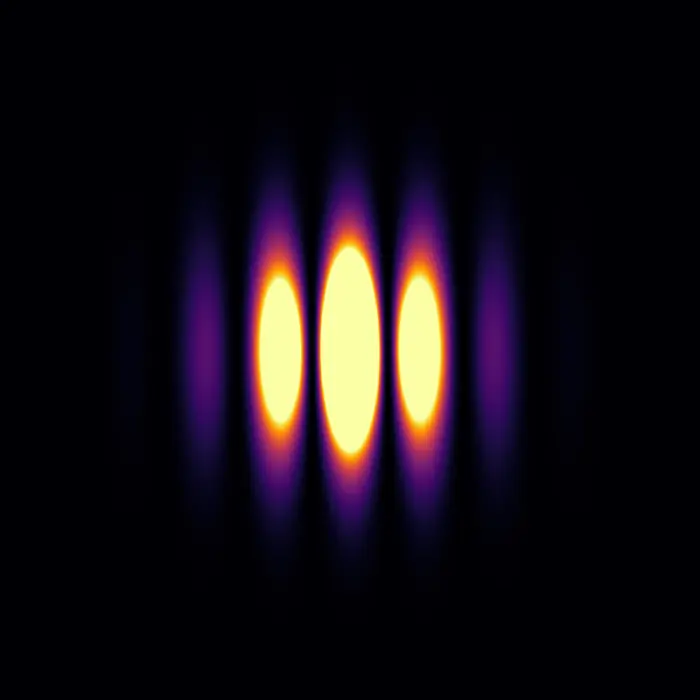

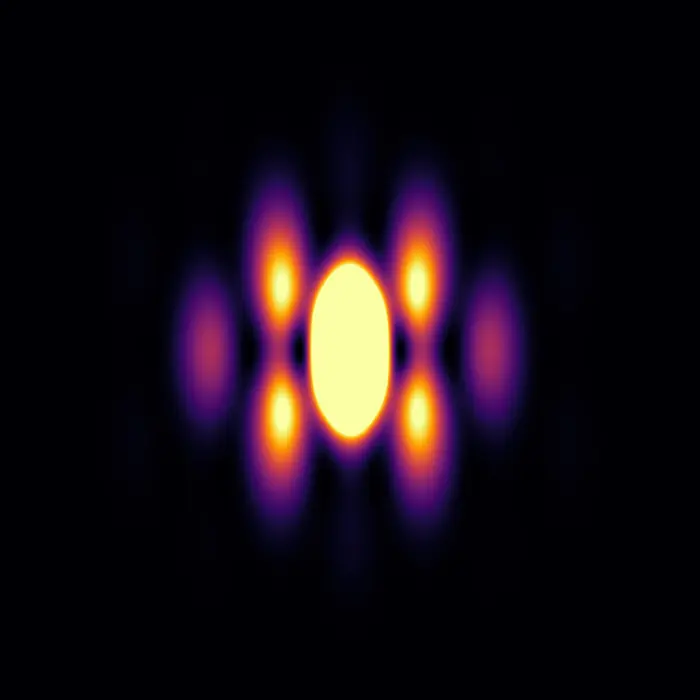
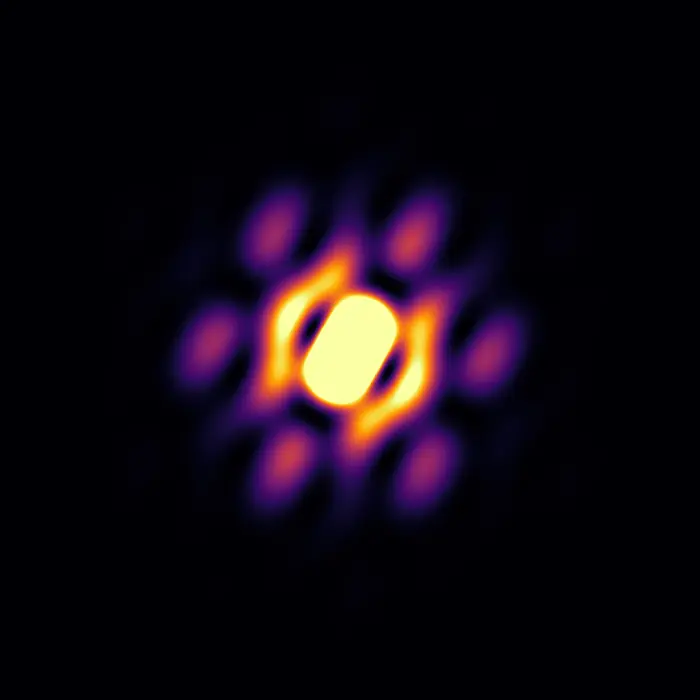
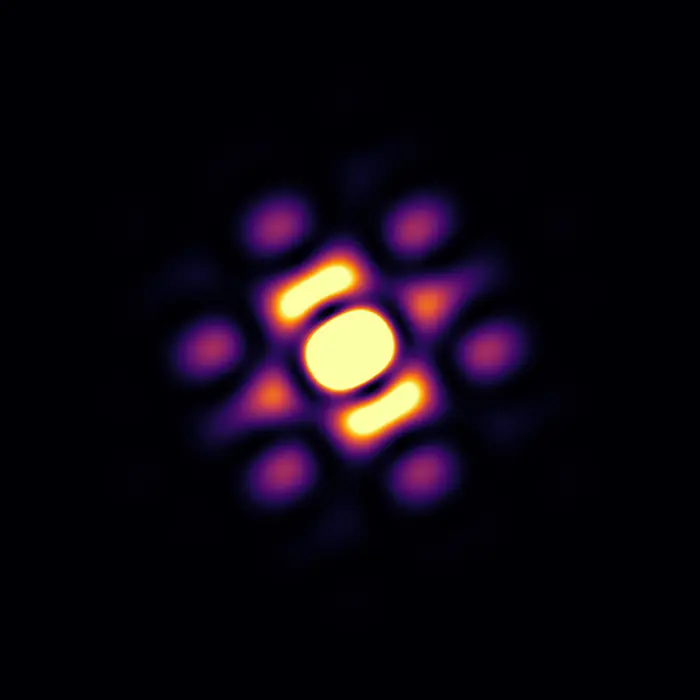
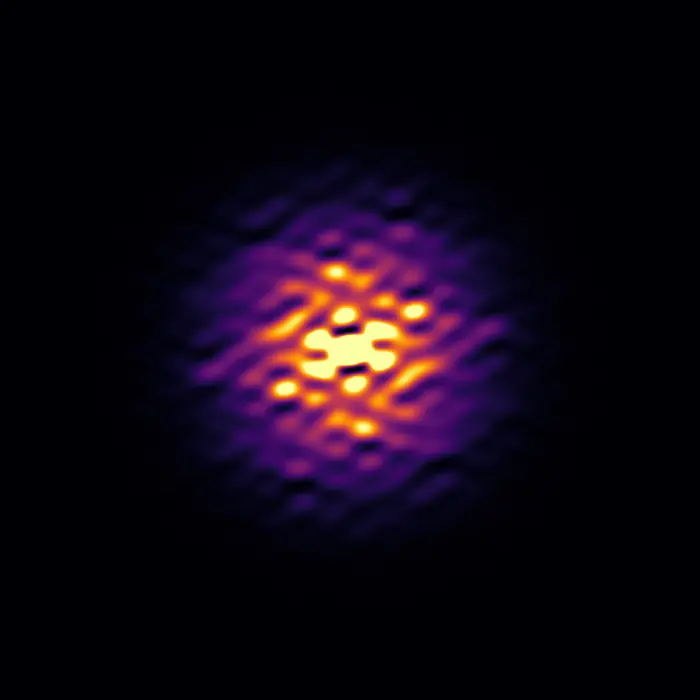 Scattering pattern
Defects and defect structures
When most atoms within a solid are arranged in some ordered fashion and such an arrangement repeats even only a few times, the solid is classified as ‘crystalline’ (https://dictionary.iucr.org/Crystal). This definition is rather flexible and somewhat vague, yet there is something we do know with certainty: ‘crystalline’ does not mean ‘periodic’. In fact, many characteristics of crystalline materials are incompatible with periodicity: from their finite size, to missing atoms, to the fact that in every unit cell atoms are slightly displaced from the positions they occupy on average—and the list goes on.
Just as an ordered repetition of atoms can result in nano- or larger crystals depending on how many times the repeat occurs, any kind of crystal aperiodicity can be locally ordered, creating coherent structures that can extend across many unit cells. When a structural deviation from average (atom displacement, vacancy, etc.) influences other deviations around it, we refer to this state as ‘correlated disorder’, since these crystal imperfections are not independent of one another, but more or less strongly ‘linked’, correlated.
The following set of images explores the local structure–crystal domain continuity: the ordering of deviations from periodicity across different length scales, which can even result in the formation of nanodomains behaving like ‘crystals within crystals’.
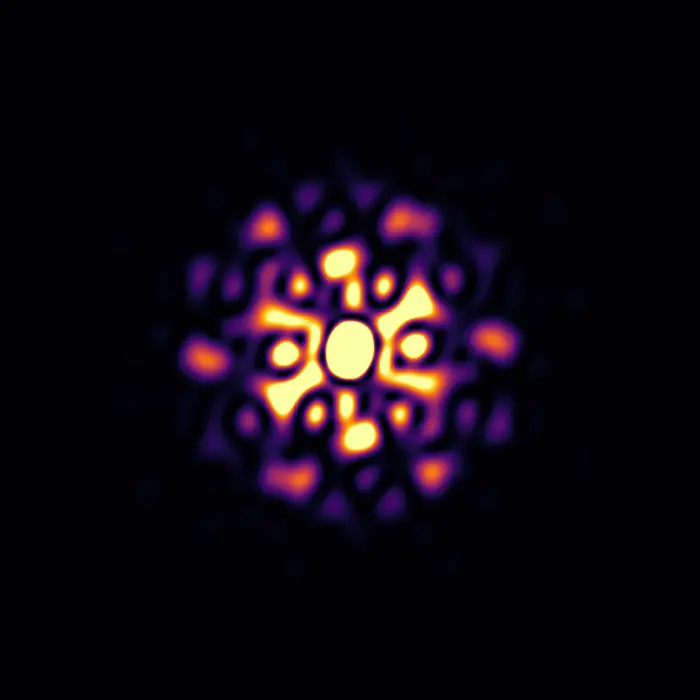
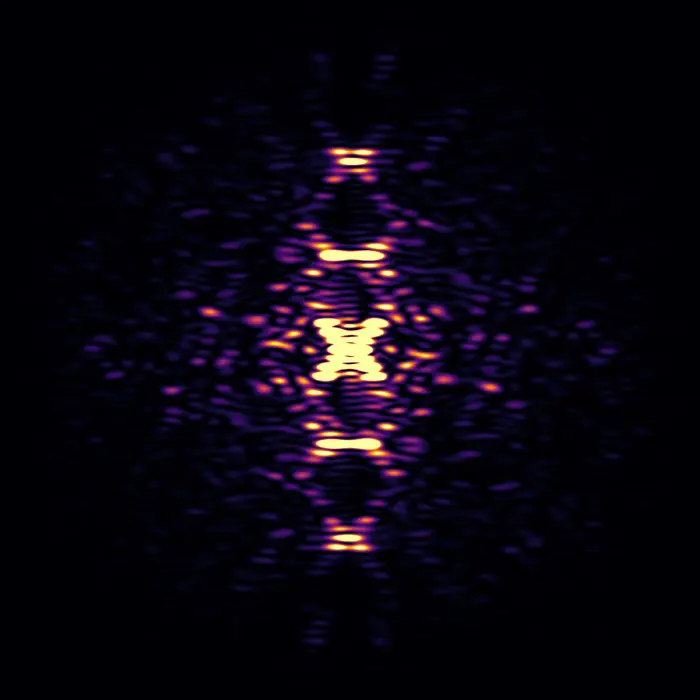
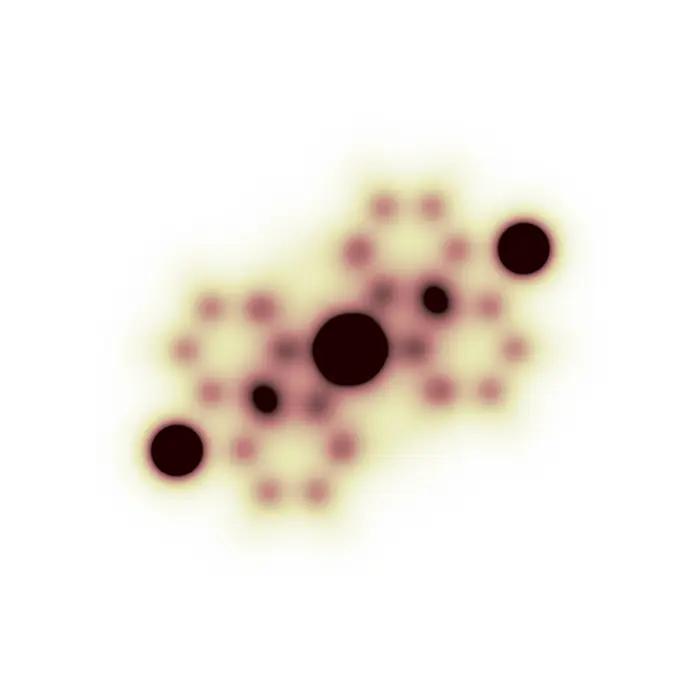
To display this phenomenon, we look at Monte-Carlo-simulated crystals of CaTiO3, where 20% of the Ca atoms are missing. This does not represent a real material, but we use it as a toy model to display how different local defect structures can be formed, and to study their influence on the resulting diffuse scattering patterns. The intensity scales have been arbitrarily chosen to enhance the diffuse features.
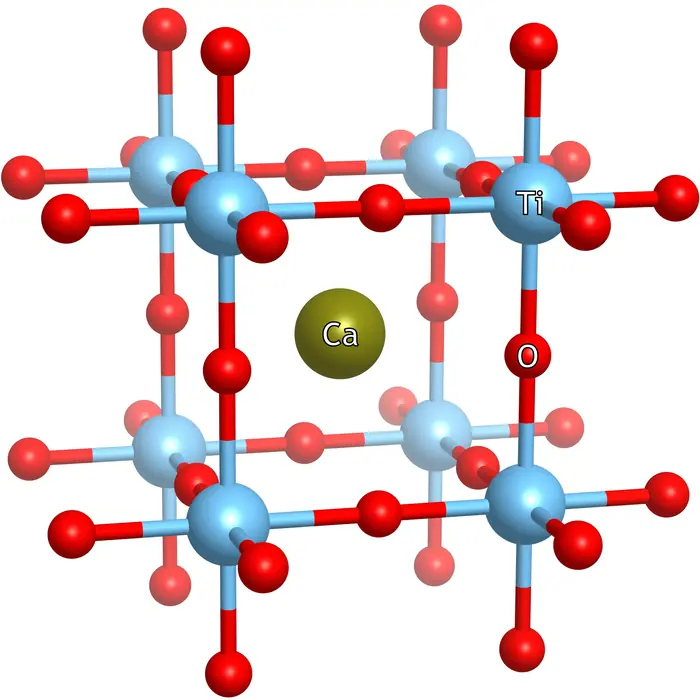
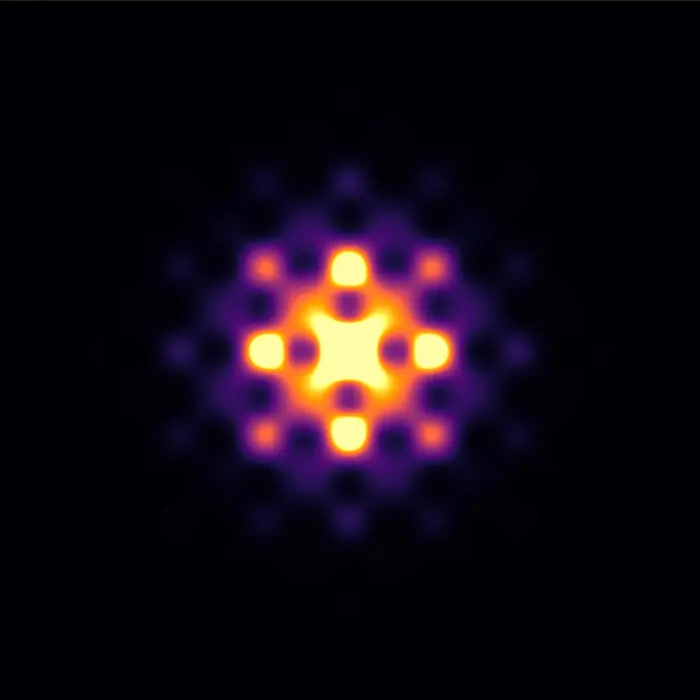
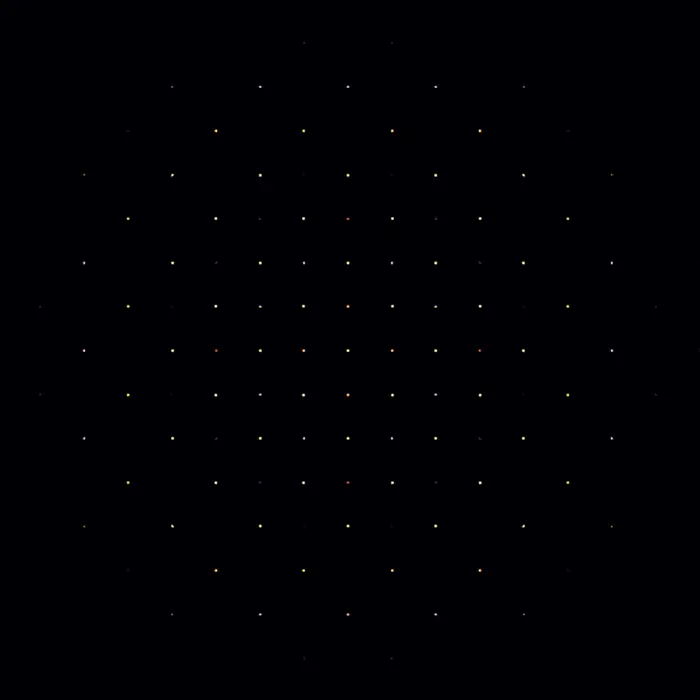
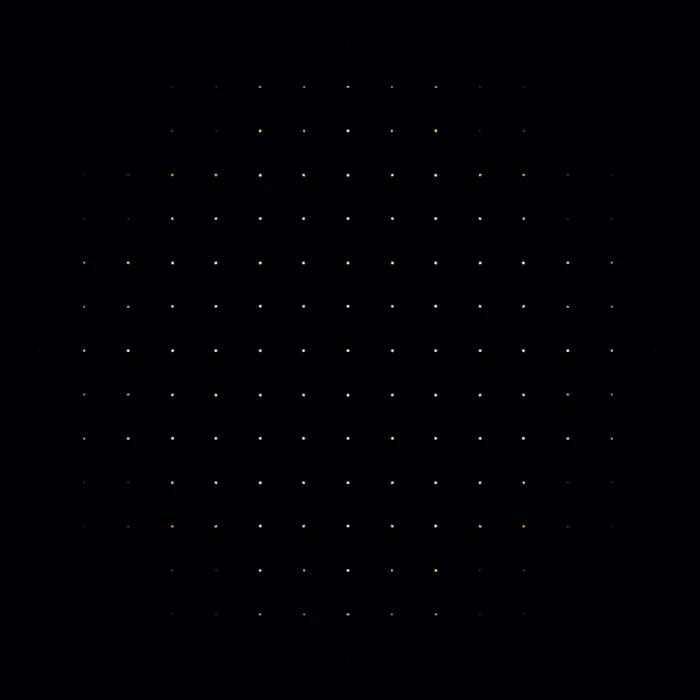
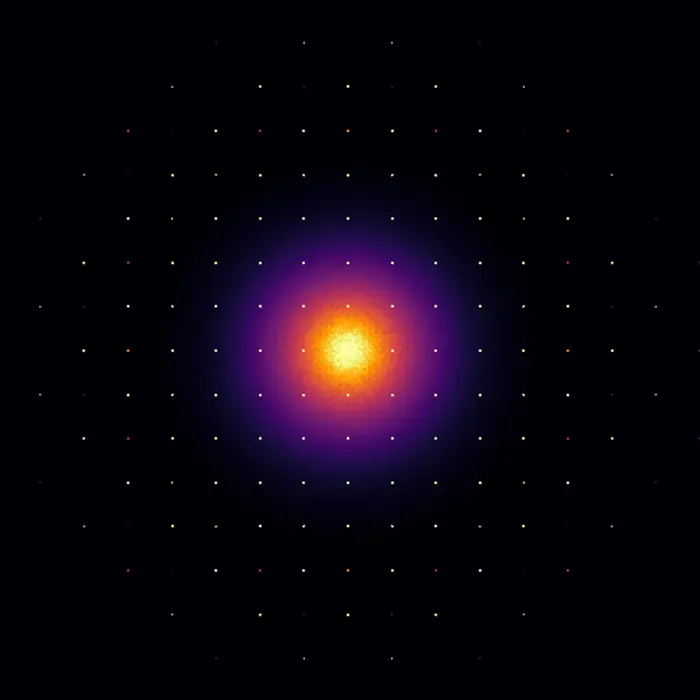
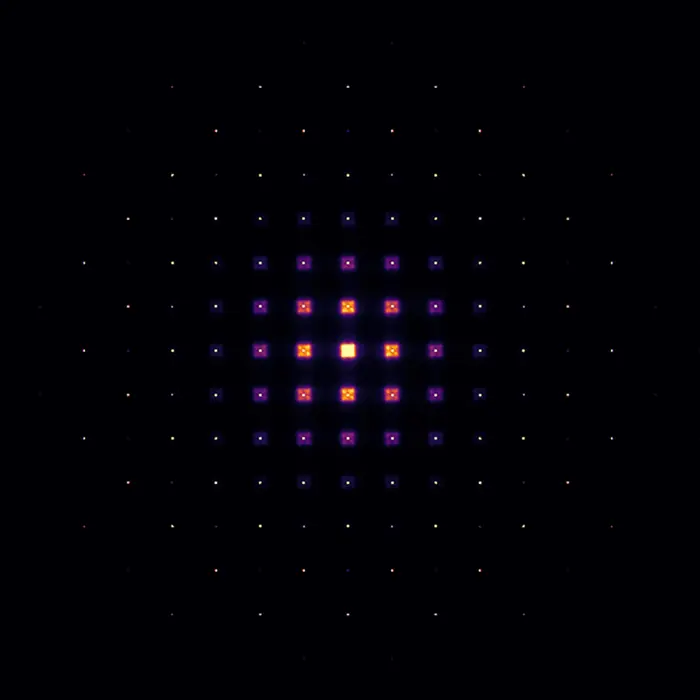
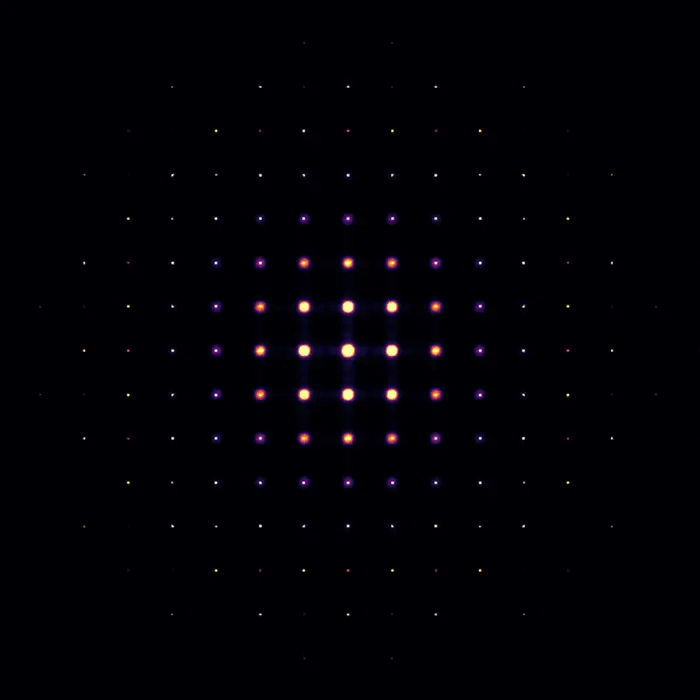
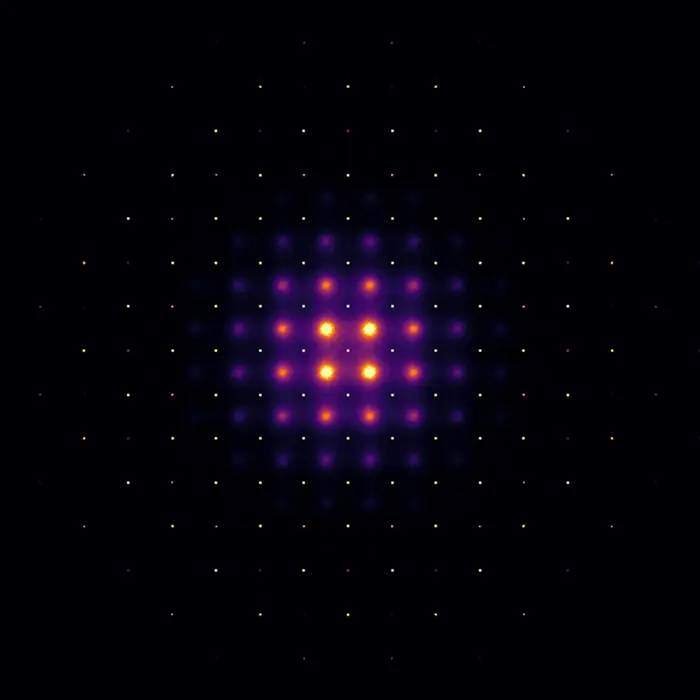
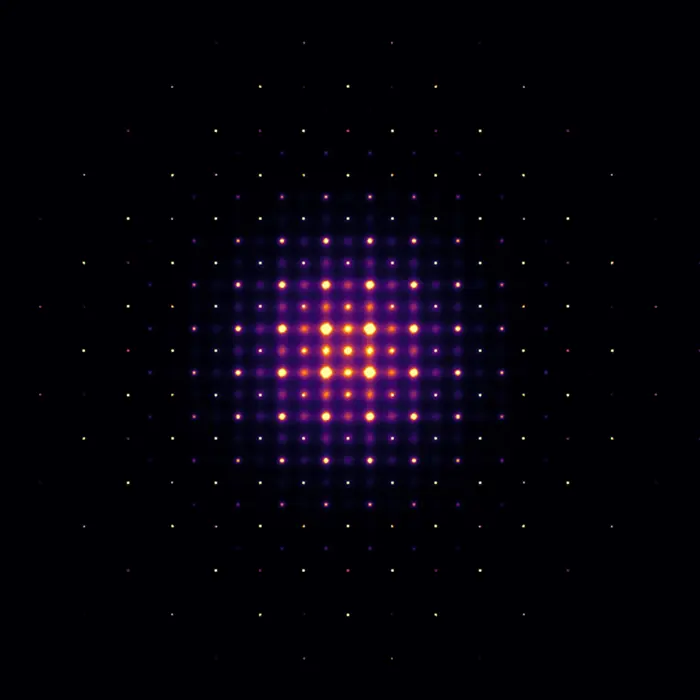
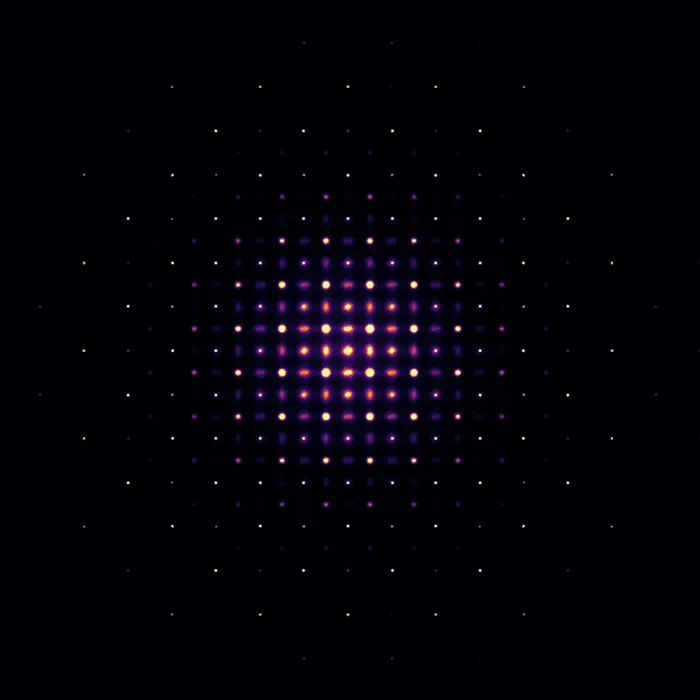
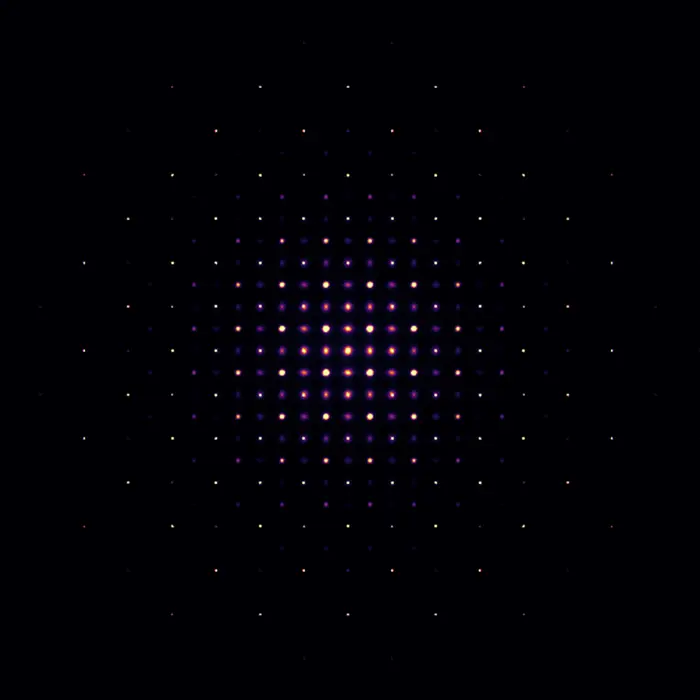
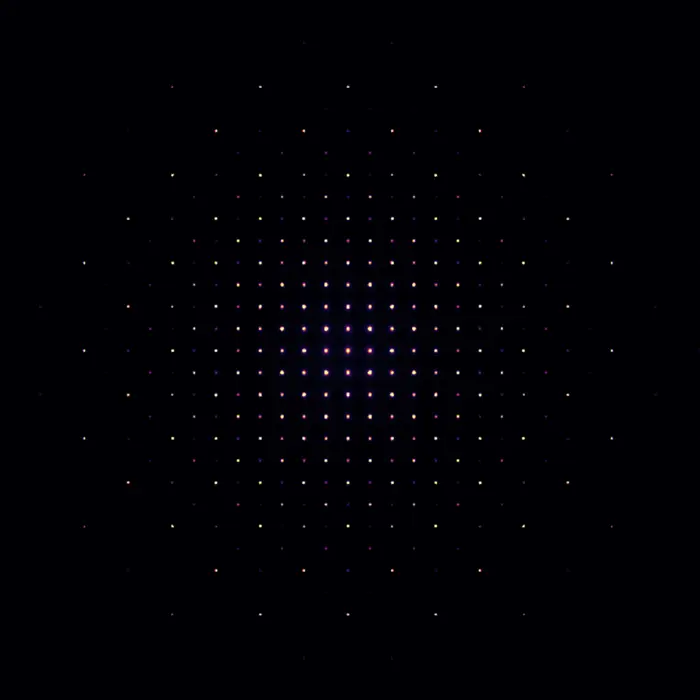
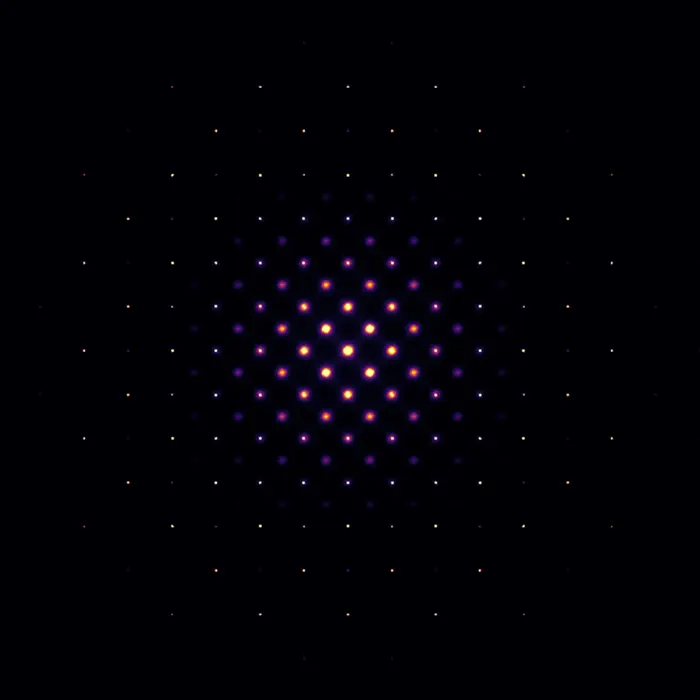
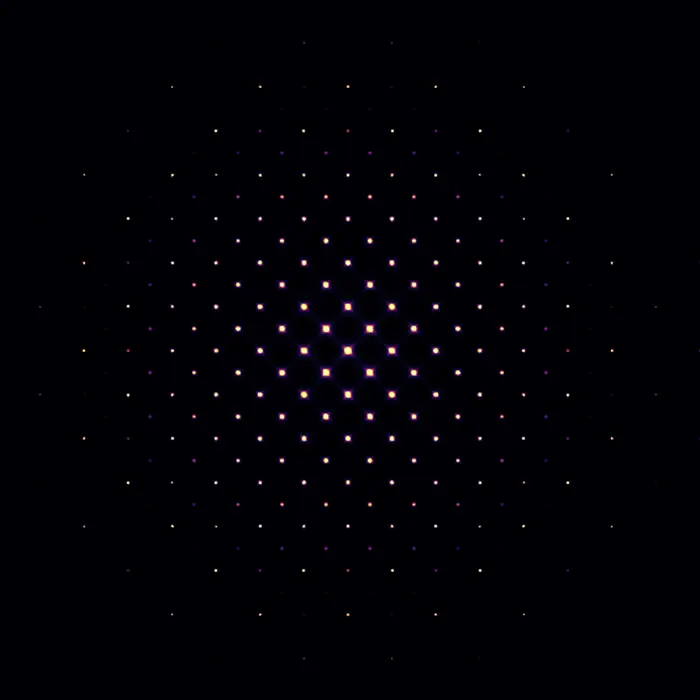
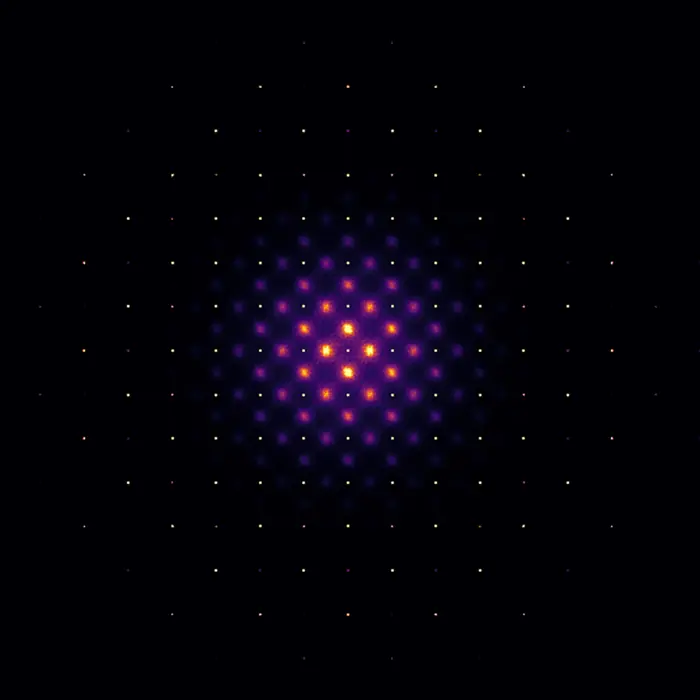
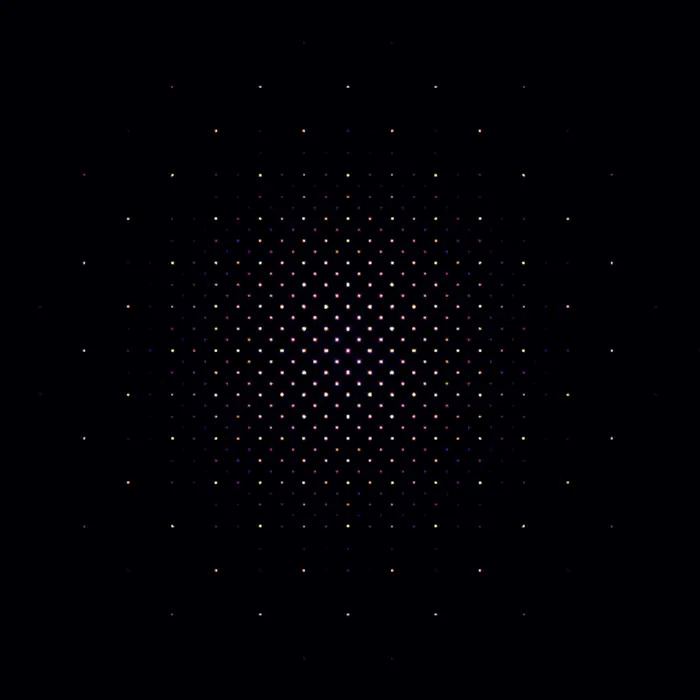
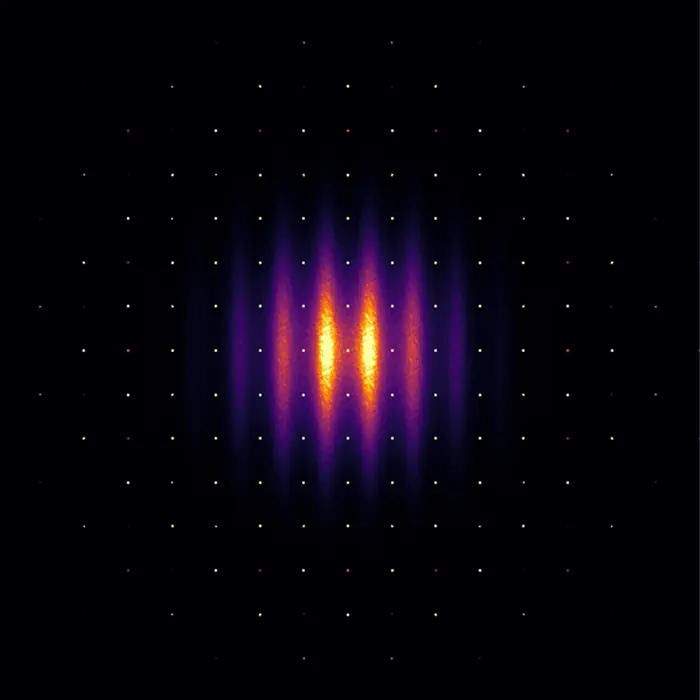
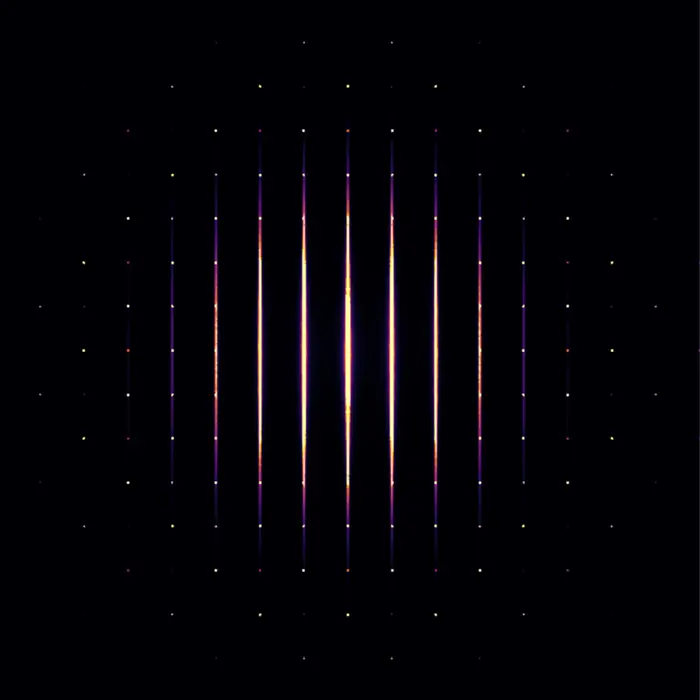
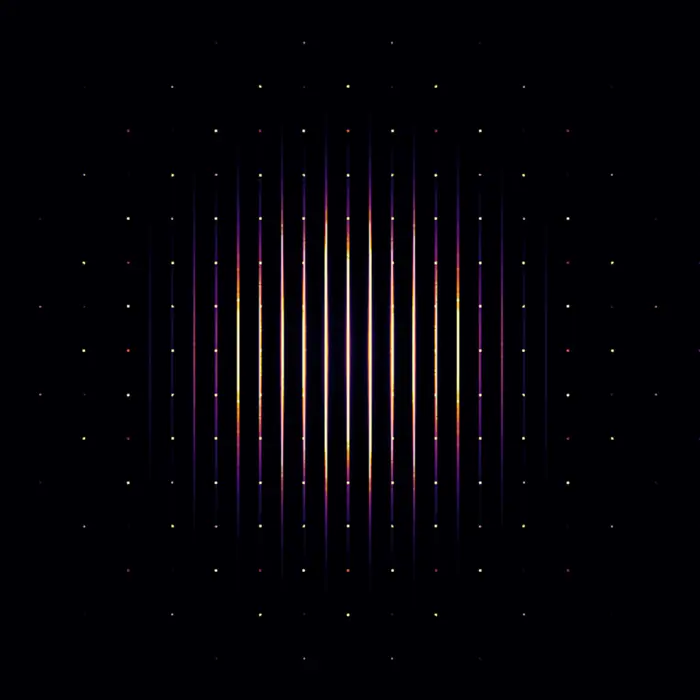
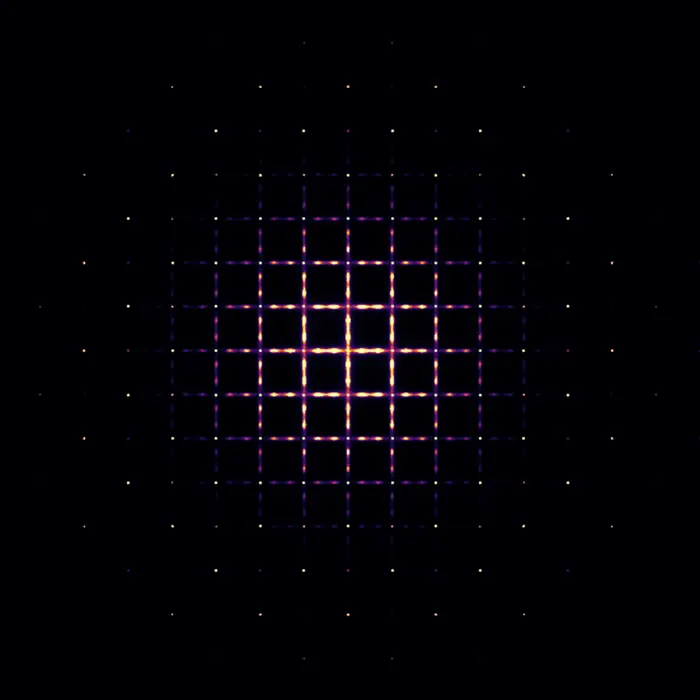
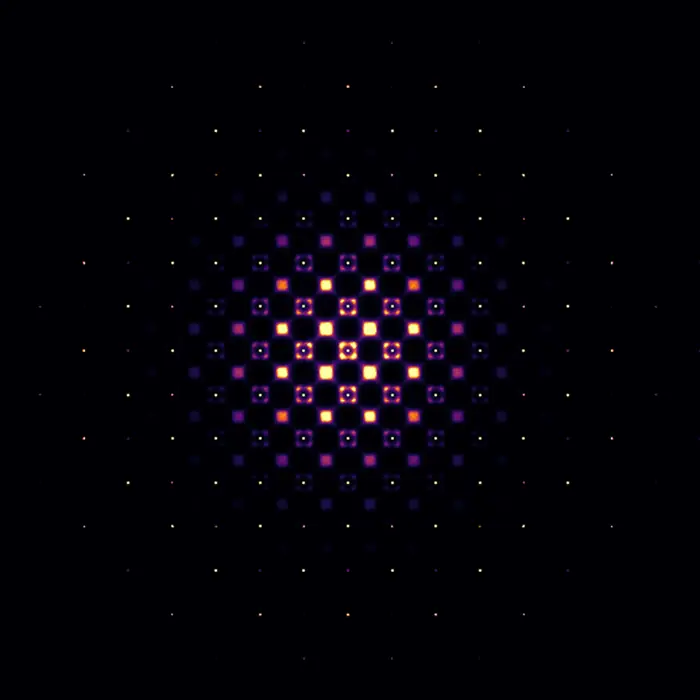
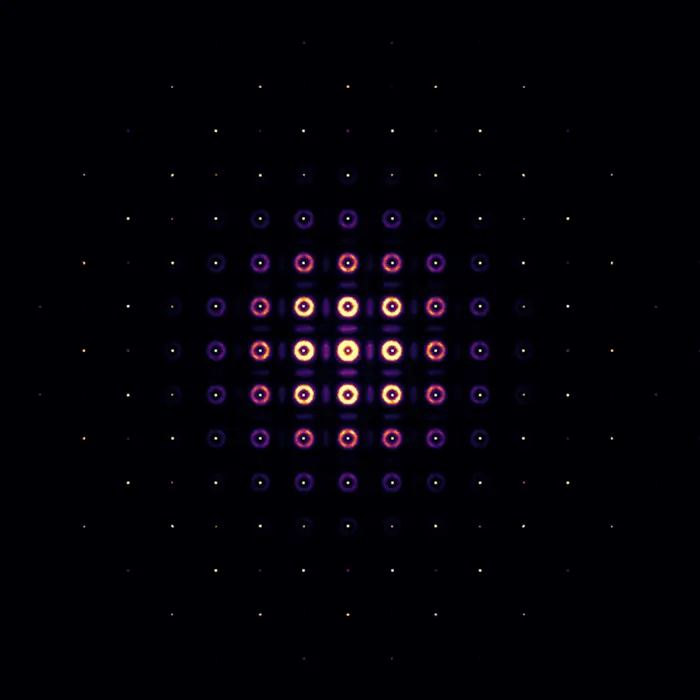 Scattering pattern
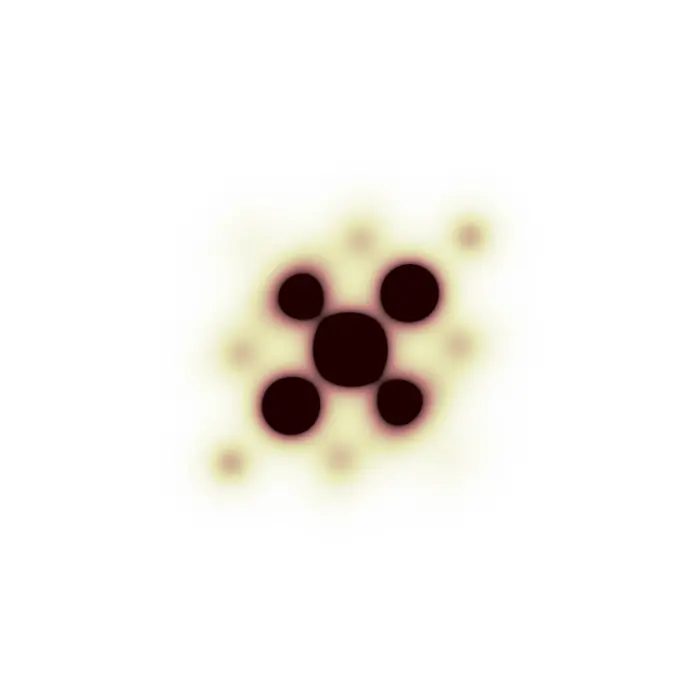
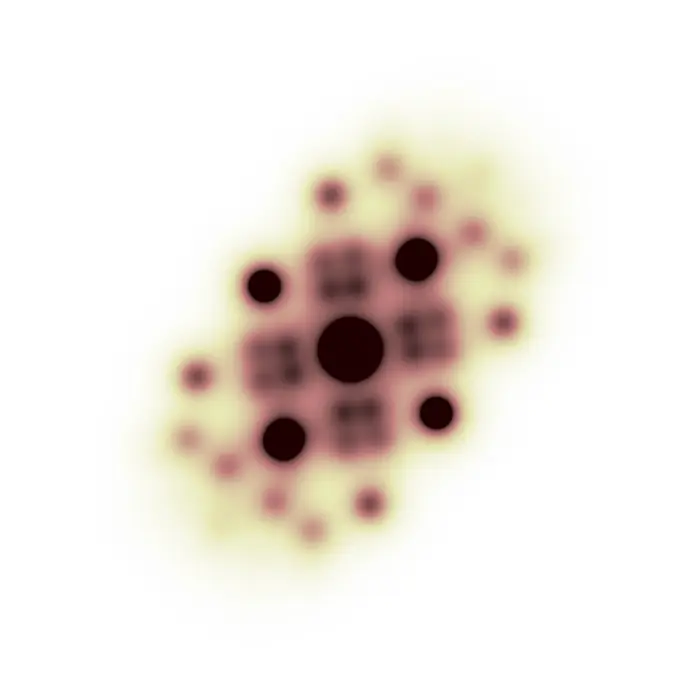
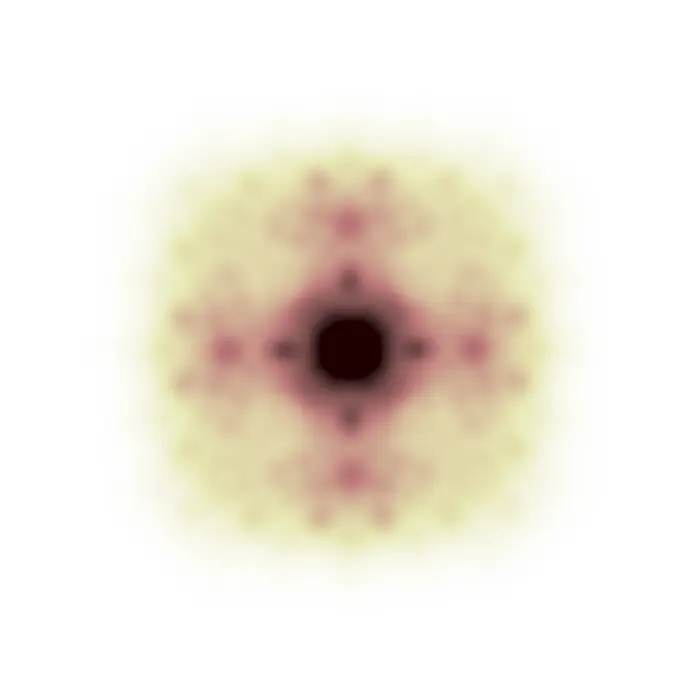
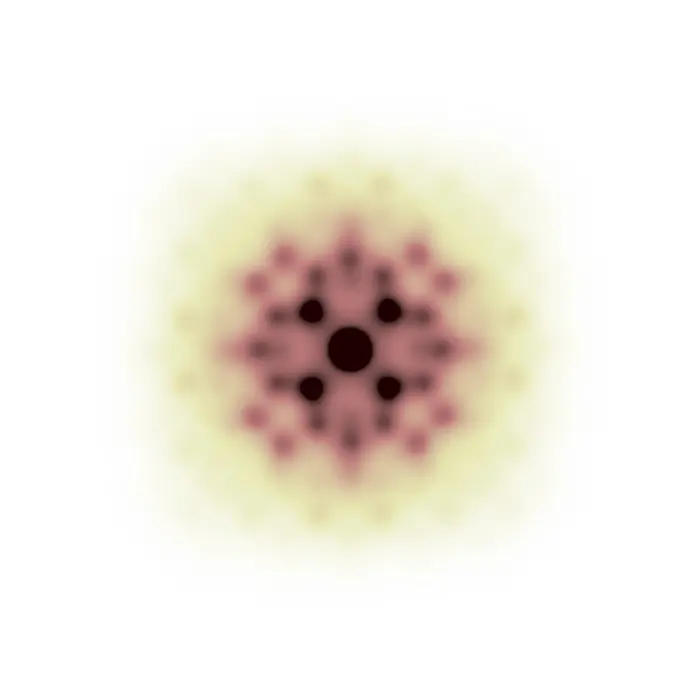
Pair Distribution Function
While the reciprocal space of a structure (which exists in real space) is its diffraction pattern, and the latter is essentially the Fourier transform of the former, by Fourier-transforming the diffraction pattern we enter a new space having strong similarities with real space, yet important differences as well.
This new domain is the pair distribution function (PDF) space, where vectors have a length in Å like in real space (and not in 1/Å like in reciprocal space), but where intensities do not represent absolute positions of atoms, but pairwise interatomic correlations. To summarize, we can consider the following relationship:
Real space (structure) —(FT)→ Reciprocal space (frequencies) —(FT)→ PDF space (correlations)
This teaching set explores the relationship between molecular structures and their PDFs, aiming to train an intuition that complements the study of related crystallographic methods such as powder and single-crystal PDF analysis, as well as the Patterson method in crystal structure determination.
The following image pairs can also be used as examinations by hiding either the structure or the PDF and guessing the other side. In fact, it is possible to conduct a back-of-the-envelope prediction of the PDF of a given structure upon drawing all its interatomic correlation vectors and transporting them onto the same origin, and then verifying whether the prediction agrees with the provided PDF. Vice versa, yet significantly more difficult, one can try to guess the molecular structure producing a given PDF map.
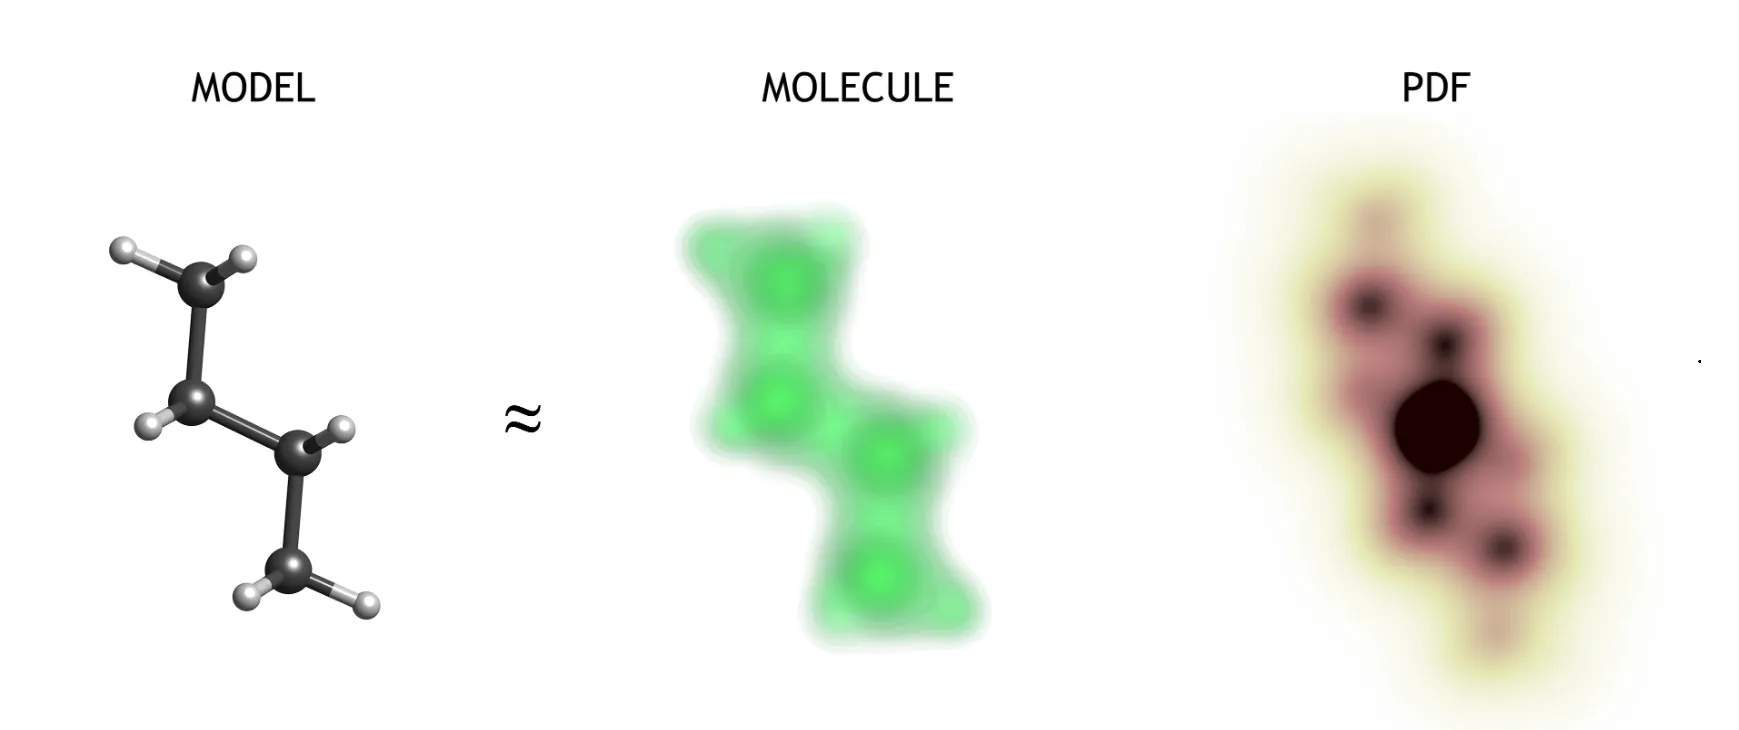
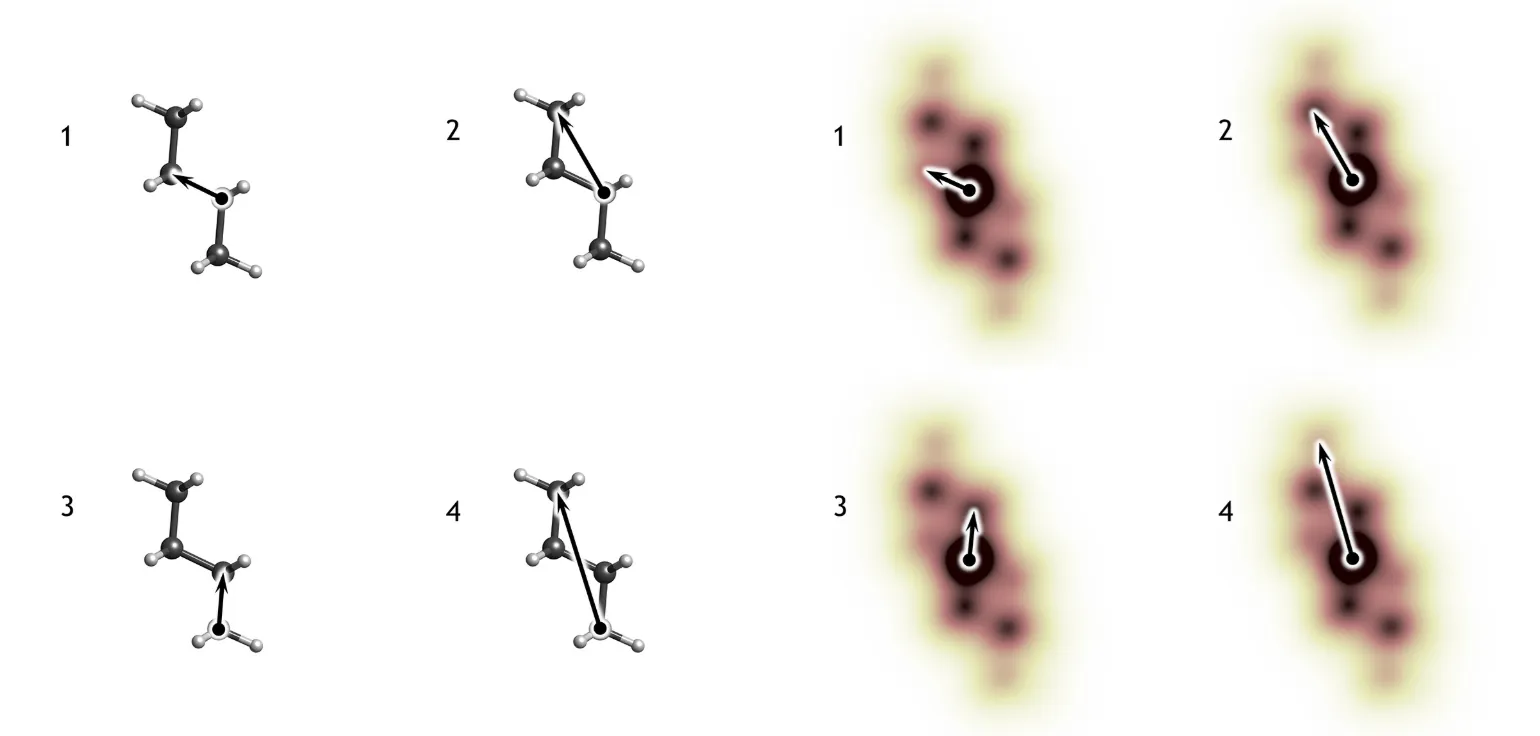
In the example explained above, vectors 2 and 3 are present twice in the molecular structure, thus they have a stronger intensity in the PDF. On the other hand, vectors 1 and 4 are present only once, and consequently are associated with weaker maxima in the PDF map. Structures and PDFs are shown with different length scales: each type of correlation vector in the structure has the exact same length in the PDF space.
N.B.: PDFs are centrosymmetric functions. This is a direct consequence of the centrosymmetric nature of interatomic correlations present in the structure, since every correlation vector goes from its point of origin to its end, and vice versa. Therefore, every interatomic vector is found together with its centrosymmetric twin in the PDF space.
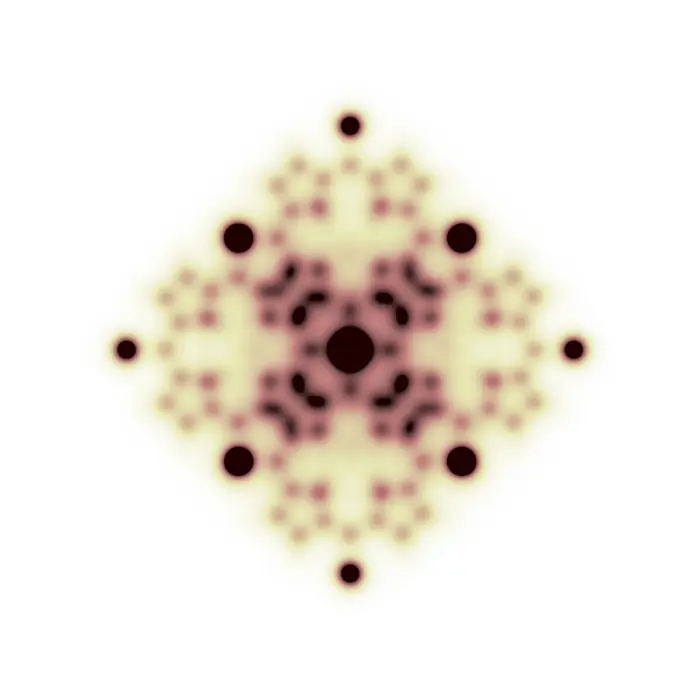
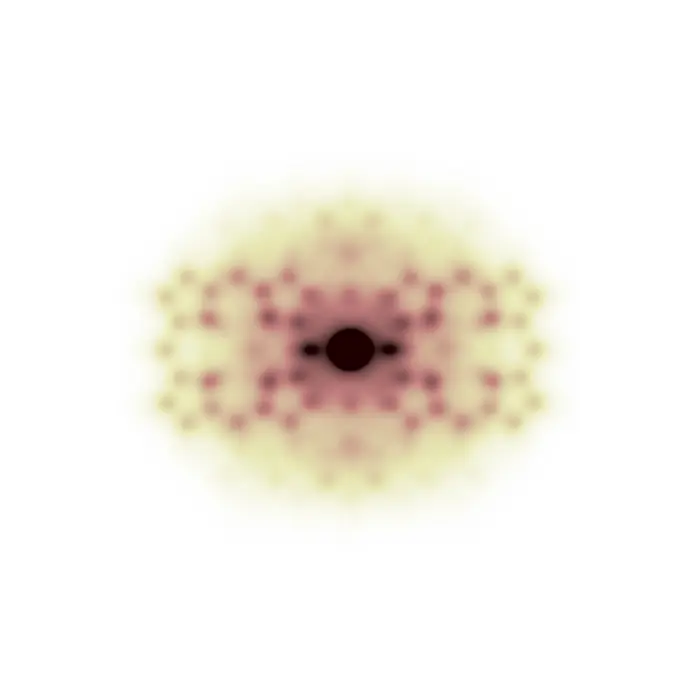
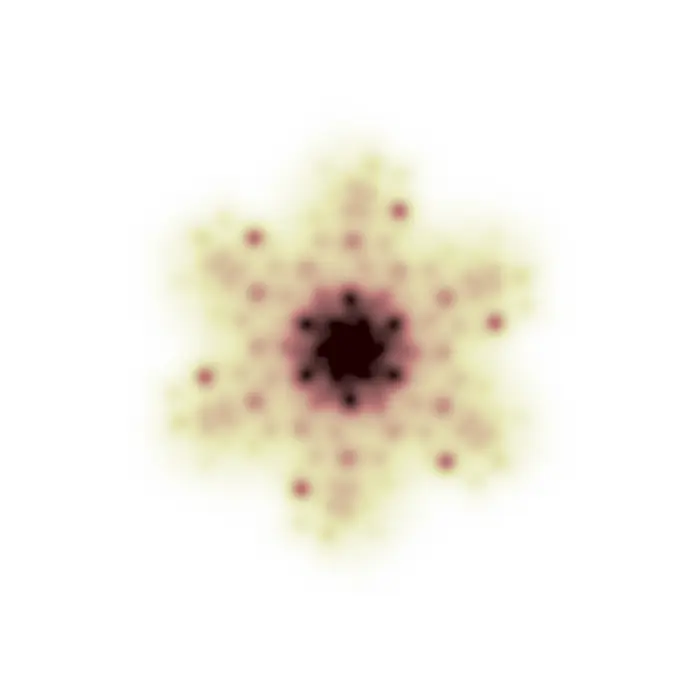
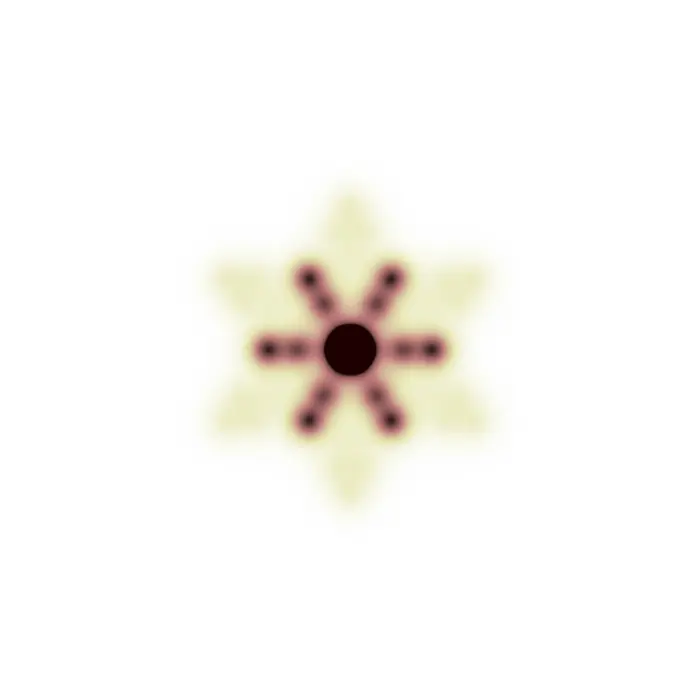
In the images below, structures will be represented by using a ball-and-stick model. This choice is optimal to display the atomic connectivity but not the real molecule in terms of its electron density distribution. Since the following PDFs are calculated by applying a Fourier transform to molecular X-ray diffraction patterns, their features directly relate to the electron density and will therefore probably be much broader than expected.
N.B.: Since PDFs originate from the correlation vectors in the molecule, they are always fully positive functions (the arbitrary intensity scale used for their display goes from 0 = white, to black, in shades of brown). Differently, in ΔPDF analysis, these functions oscillate between negative and positive values because they represent the difference between the full PDF (or, as simply named in this set, PDF) and the PDF of the average structure (also known as the Patterson function).
 PDF space